Fleet DNA: Commercial Fleet Vehicle Operating Data
The Fleet DNA clearinghouse of commercial fleet vehicle operating data helps vehicle manufacturers and developers optimize vehicle designs and helps fleet managers choose advanced technologies for their fleets.
This online tool, which provides data summaries and visualizations similar to real-world "genetics" for medium- and heavy-duty fleet vehicles, helps users understand the broad operational range of commercial vehicles across vocations and weight classes.
 Delivery Vans
 Delivery Trucks
 School Buses
 Transit Buses
Delivery Vans
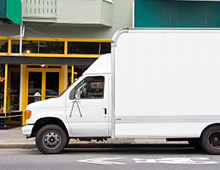
The delivery van category includes data for walk-in and step vans ranging in size from class 3 to class 6 with primary vocations of delivering parcels, food, linens, or beverages.
Fleet DNA has 974 days of driving data from 94 delivery vans operating in the United States.
Data Summary and Visualizations
Related Studies
Learn more about the operation of delivery vans through these studies.
Project Results: Evaluating FedEx Express Hybrid-Electric Delivery Trucks
FedEx Express Gasoline Hybrid Electric Delivery Truck Evaluation: 12-Month Report
FedEx Gasoline Hybrid Electric Delivery Truck Evaluation: 6-Month Interim Report
Eighteen-Month Final Evaluation of UPS Second Generation Diesel Hybrid-Electric Delivery Vans
Thirty-Six Month Evaluation of UPS Diesel Hybrid-Electric Delivery Vans
Interim Project Results: United Parcel Service's Second-Generation Hybrid-Electric Delivery Vans
Project Overview: United Parcel Service's Second-Generation Hybrid-Electric Delivery Vans
United Parcel Service Evaluates Hybrid Electric Delivery Vans
Twelve-Month Evaluation of UPS Diesel Hybrid Electric Delivery Vans
Delivery Trucks
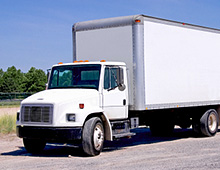
The delivery truck category includes data for city delivery, straight trucks, stake body vehicles, furniture trucks, rack trucks, and beverage delivery trucks ranging in size from class 3 to class 7 with primary vocations of delivering parcels, food, linens, beverages, or warehouse items.
Fleet DNA has 553 days of driving data from 36 delivery trucks operating in the United States.
Data Summary and Visualizations
Related Studies
Learn more about the operation of delivery trucks through these studies.
School Buses
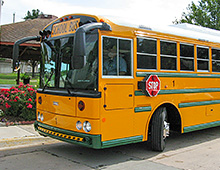
The school bus category includes data for a wide range of school bus types, including class A to class D body types sized from class 3 to class 6.
Fleet DNA has 857 days of driving data from 204 school buses operating in the United States.
Data Summary and Visualizations
Related Studies
Learn more about the operation of school buses through these studies.
A Statistical Characterization of School Bus Drive Cycles Collected via Onboard Logging Systems
Drive Cycle Analysis, Measurement of Emissions and Fuel Consumption of a PHEV School Bus
Transit Buses
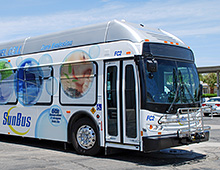
The transit bus category includes a wide range of data for buses operating on shorter-distance public transport bus services, which include single- and double-deck buses, articulated buses and midibuses. The typical operating weight range for this category is class 7 and 8 with the primary vocation being mass transit.
Fleet DNA has 472 days of driving data from 19 transit buses operating in the United States.
Data Summary and Visualizations
Related Studies
Learn more about the operation of transit buses through these studies.
St. Louis Metro Biodiesel (B20) Transit Bus Evaluation
King County Metro Transit Hybrid Articulated Buses: Final Evaluation Results
Case Study: Ebus Hybrid Electric Buses and Trolleys
Long Beach Transit: Two-Year Evaluation of Gasoline-Electric Hybrid Transit Buses
In-Use Performance Comparison of Hybrid Electric, CNG, and Diesel Buses at New York City Transit
BAE/Orion Hybrid Electric Buses at New York City Transit
New York City Transit Hybrid and CNG Transit Buses: Final Evaluation Results
 Bucket Trucks
 Service Vans
 Tractors
 Refuse Trucks
Bucket Trucks
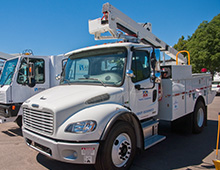
The bucket truck category includes data for a wide range of vehicle chassis builds that have a powered overhead boom with a bucket attachment. The sizes of the vehicles in the database range from class 3 to class 7 with vocational applications in the utility and telecommunications fields.
Fleet DNA has 283 days of driving data from 20 bucket trucks operating in the United States.
Data Summary and Visualizations
Service Vans
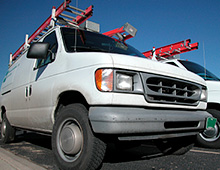
The service van category includes data for both service and utility vans ranging in size from class 2 to class 3 with vocational applications in the utility and telecommunications fields.
Fleet DNA has 29 days of driving data from 4 service vans operating in the United States.
Data Summary and Visualizations
Tractors
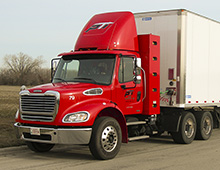
The tractor category includes data for a wide range of vehicle types and configurations, including beverage delivery tractors, semis, sleeper semis, and refrigerated trucks that each have a removable trailer and range in size from class 7 to class 8. Vehicles in this category also include a wide range of vocations, such as beverage, fuel, and food delivery, and regional and long-hauling activities.
Fleet DNA has 1,150 days of driving data collected from 70 tractors operating in the United States.
Data Summary and Visualizations
Related Studies
Learn more about the operation of tractors through these studies.
Coca-Cola Refreshments Class 8 Diesel Electric Hybrid Tractor Evaluation: 13-Month Final Report
Project Startup: Evaluating Coca-Cola's Class 8 Hybrid-Electric Delivery Trucks
Refuse Trucks
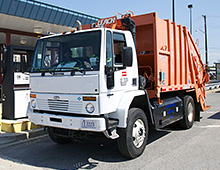
The refuse truck category includes data for a wide range of refuse-hauling vehicles, including front-, side-, and real-loading refuse trucks in addition to dumpster-hauling trucks. The typical operating weight range for this category is class 8, and the primary vocation is refuse pickup.
Fleet DNA has 387 days of driving data from 39 refuse trucks operating in the United States.
Data Summary and Visualizations
Composite Data for All Categories
View charts with data for all the vehicle categories above or download the composite data for all vehicles.
Connect with Clean Cities
Through the U.S. Department of Energy's National Clean Fleets Partnership, Clean Cities and Communities works with large private fleets to cut petroleum use. To connect with Clean Cities and Communities in your area, find a coalition.
Tools and Resources
Use these tools to analyze and sort transportation data:
FleetREDI: Fleet Research, Energy Data, and Insights – Access our interactive online portal for commercial vehicle data and energy insights.
DRIVE: Drive-Cycle Rapid Investigation, Visualization, and Evaluation Analysis Tool — Produce drive cycles from real-world vehicle data to cut evaluation and analysis time.
T3CO: Transportation Technology Total Cost of Ownership – Explore fast, customizable commercial vehicle total cost of ownership analyses.
Browse our complete list of data and tools.
How To Use the Data
Use these resources to understand the data and get ideas on how to use drive cycle metrics:
Documentation
How Road Grade Data Is Added to Fleet DNA
Examples
Map Matching and Real World Integrated Sensor Data Warehousing
How To Contribute Your Data
You can contribute your fleet's data anonymously to Fleet DNA to help other fleets analyze and improve their drive cycle metrics. Learn more in the fact sheet on Contributing Data to the Fleet DNA Project.
How To Cite the Data
Publications that use data from Fleet DNA should include a citation consistent with the following format:
“Fleet DNA Project Data.” ([YEAR]). National Renewable Energy Laboratory. Accessed [DATE]: www.nrel.gov/fleetdna
If you use the data in a publication, please notify Andrew Kotz so we can gauge the reach of the data.
More Information
Contact us at fleetdna@nrel.gov for more information.
Share
