Distributed Wind Energy Futures Study
NREL's Distributed Wind Energy Futures Study informs wind developers, grid planners, utilities, policymakers, and other stakeholders about opportunities for widespread U.S. distributed wind deployment in 2035.

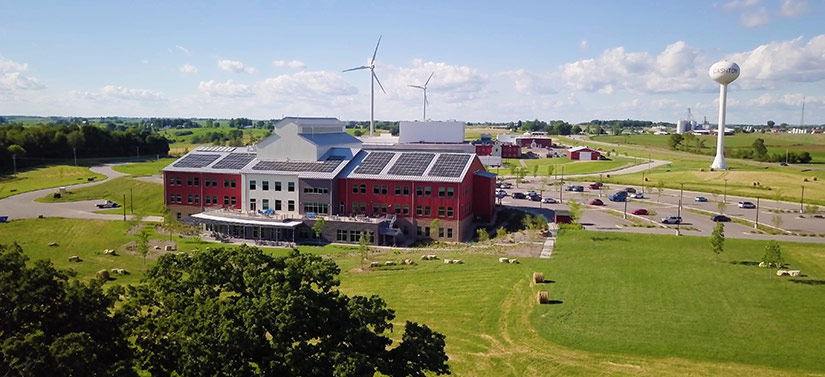
Distributed wind could play a meaningful role in the U.S. energy future. Photo from David Nevala Photography for CROPP Cooperative
Watch the Distributed Wind Energy Potential National Wind Energy Association 2024 Webinar on YouTube to learn more.
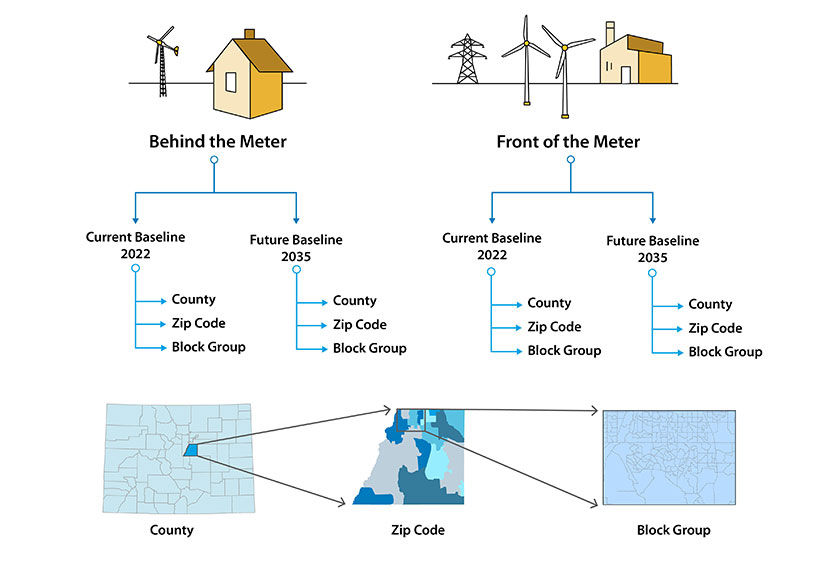
NREL's Distributed Wind Energy Futures Study is a regularly updated data product supporting geospatial analysis that informs wind developers, grid planners, utilities, policymakers, and other stakeholders about opportunities for widespread U.S. distributed wind deployment. We assess both current and future scenarios to understand the opportunity now as well as how the landscape for investment in distributed wind may change in the coming years. Funded by the U.S. Department of Energy's (DOE's) Wind Energy Technologies Office, this study uses highly detailed data and new modeling techniques to identify locations with the highest potential for distributed wind energy. The findings can help communities transition to a clean energy future.
About Distributed Wind
Distributed wind energy refers to wind technologies deployed as distributed energy resources. These technologies are place-based solutions that support individuals, communities, and businesses transitioning to carbon-free electricity.
Distributed wind can be placed in behind-the-meter applications, where the system
directly offsets a specific end user's consumption of retail electricity supply, or
in front-of-the-meter applications where the system is interconnected to the distribution
network and provides community-scale energy supply while bolstering the robustness,
reliability, and resiliency of the local distribution network. Distributed wind installations
can range from a less than-1-kW off-grid wind turbine that powers telecommunications
equipment to a 10-MW community-scale energy facility.
Parcel-Level Modeling for Detailed Insights

The Distributed Wind Energy Futures Study leverages a highly detailed assessment of more than 150 million U.S. land parcels to enable a high-resolution view of the landscape of opportunity for distributed wind deployment. The study uses the Distributed Wind (dWind) model, a module within the Distributed Generation Market Demand (dGen™) model suite.
To explore this high-resolution dataset, NREL has developed the DW Scenario Analyzer. This tool allows users to explore the key data products of the research. Raw data are published on the Department of Energy Atmosphere to Electrons (A2e) Wind Data Portal. With this portal, county, ZIP code, and U.S. census block group statistics can be downloaded to make custom maps or to conduct user-specific analysis.
An Immense Opportunity for Economic Development
The findings show that the potential for distributed wind energy is considerably higher than previously estimated. We calculate that there are 8,695 GW of distributed wind technical potential for front-of-the-meter applications in the Baseline 2022 scenario and 7,796 GW in the Baseline 2035 scenario, which is, on average, 1.8 times more technical potential in the contiguous United States than previously reported. Similarly, there is, on average, 2.1 times more technical potential for behind-the-meter applications: 1,749 GW in the Baseline 2022 scenario and 3,743 GW in the Baseline 2035 scenario. These gains underscore the vast untapped potential of distributed wind energy.
The improved model also highlights additional economic potential for behind-the-meter applications, demonstrating distributed wind’s promise as a cost-effective renewable energy source. Compared to the estimated 4,000 TWh of electricity consumption in the United States, a substantial fraction of that energy could be generated with distributed wind technology. Taking the most conservative estimates, 2.5% of demand could be satisfied using economic behind-the-meter scenarios, and an additional 78.5% of demand could be satisfied with economic front-of-the-meter scenarios. Additional incentives for deployment or more favorable net metering regulations (for behind-the-meter scenarios) would allow an even greater potential.
Rural and Agricultural Regions Are Poised for Near-Term Adoption
NREL finds the regions with the highest potential for distributed wind tend to have a combination of high-quality wind, relatively high electricity rates for behind-the-meter applications, higher wholesale power rates for front-of-the-meter applications, and siting availability.
The Midwest has the overall highest potential for distributed wind. The Pacific Northwest and Northeast regions have significant potential for expansion of behind-the-meter distributed wind deployments. States with the most near-term potential for behind-the-meter applications include Texas, Minnesota, Montana, Colorado, Indiana, and Oklahoma. States with the most near-term potential for front-of-the-meter applications include Oklahoma, Nebraska, Iowa, Illinois, Kansas, and South Dakota.
In alignment with recent incentive programs from the U.S. Department of Agriculture and DOE, we also note significant existing opportunities for distributed wind generation in agricultural and rural areas: The top 10 states for front-of-the-meter systems have an annual energy production of 1,199 TWh, and the top 10 states for behind-the-meter applications have an annual energy production of 19 TWh. Overall, agricultural land represents 33% of the total distributed wind opportunity for the 2022 behind-the-meter scenario, and 42% for the 2022 front-of-the-meter scenario, indicating that agricultural and rural areas represent the greatest opportunity for distributed wind—more than any other land use type.
Maps for the Contiguous United States

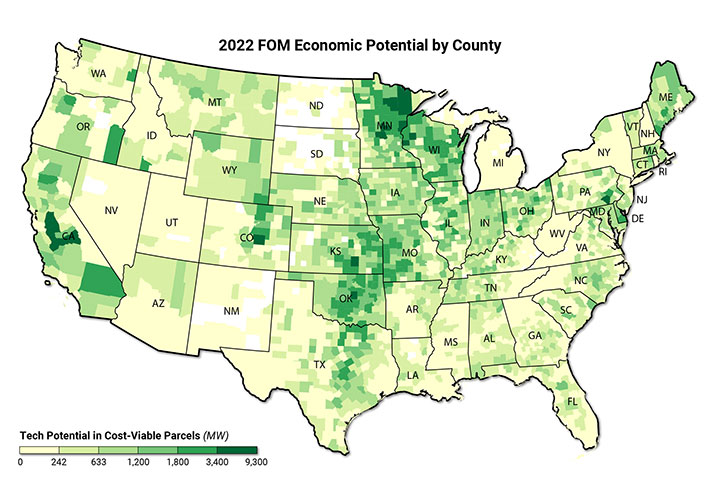
The economic potential of front-of-the-meter wind applications in 2022. Oklahoma, Nebraska, Illinois, Kansas, Iowa, South Dakota, Pennsylvania, New York, Montana, and New Mexico have the highest potential.

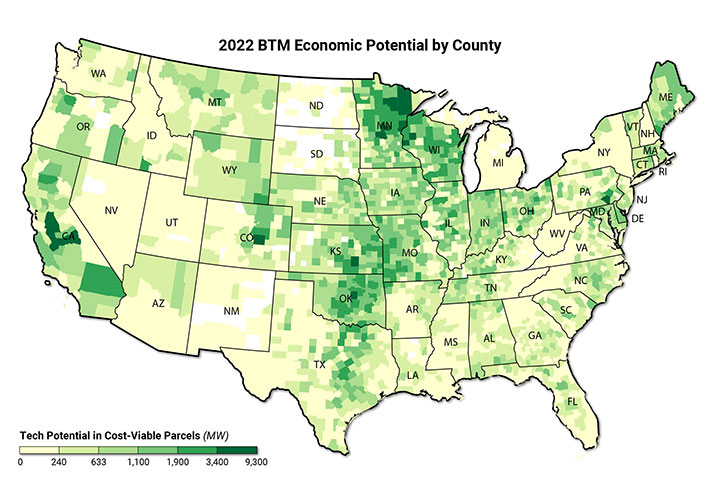
The economic potential of behind-the-meter wind applications in 2022. Texas, Minnesota, Montana, Colorado, Oklahoma, Indiana, South Dakota, North Dakota, New Mexico, and Kentucky have the greatest economic potential.
Publications
A Parcel-Level Evaluation of Distributed Wind Opportunity In the Contiguous United States, Wind Energy Science (2024)
Distributed Wind Energy Futures Study, NREL Presentation (2022)
Distributed Wind Energy Futures Study, NREL Technical Report (2022)
Assessing the Future of Distributed Wind: Opportunities for Behind-the-Meter Projects, NREL Technical Report (2016)
Contact
For general questions about Distributed Wind Futures, email the Distributed Wind Futures team.
Share
Last Updated April 21, 2025
