Modeling, Mapping, and Analysis Consortium
The NREL-led Modeling, Mapping, and Analysis Consortium (MMAC) offers insights to secure domestic manufacturing and energy supply chains.

Funded by the U.S. Department of Energy's Office of Manufacturing and Energy Supply Chains, the MMAC brings together state-of-the-art research capabilities from NREL, Argonne National Laboratory, and Idaho National Laboratory.
Research
A secure and resilient energy sector industrial base is crucial to the modernization of the nation's infrastructure in support of the energy transition. MMAC leverages cross-collaborative capabilities, a robust analysis framework, and unmatched access to complex datasets to identify potential supply chain gaps and opportunities. MMAC's objective analysis of the material supply and manufacturing base guides federal investments to strengthen domestically focused and globally resilient energy supply chains.

MAPPING
Global installed manufacturing
Material prices
Minerals mapping
Supply chain mapping
Threat/intelligence
MODELING
Supply chain bottleneck assessment
System dynamics modeling
Agent-based modeling
Deployment projections
Material flow equations
Spatial modeling
Discrete event modeling
Logistics optimization
ANALYSIS
Global trade flows
Life cycle analysis
Techno-economic analysis
Workforce analysis
End-of-life disposal and recycling
Material flow analysis
Competitiveness analysis
Economic impact
Policy impact analysis
Implementation support
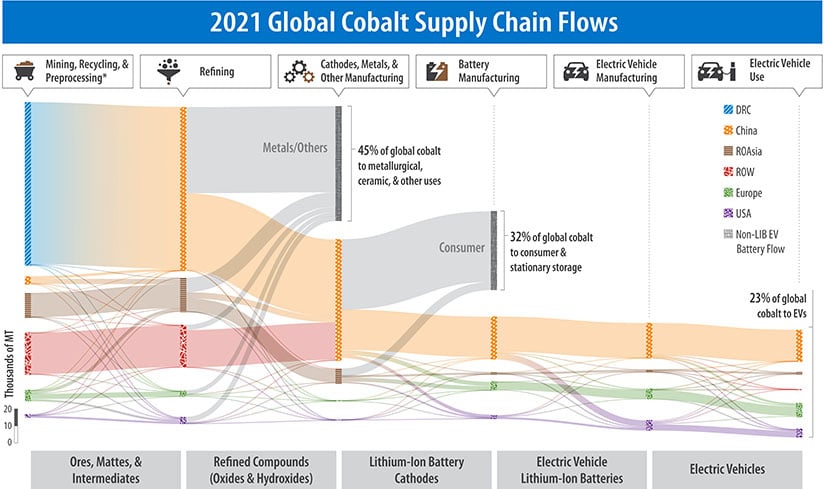
As part of MMAC, NREL researchers are analyzing the global flow of materials throughout the energy sector industrial base to evaluate supply chain gaps and investment opportunities. Mapped for cobalt in the graphic below, this example illustrates the movement of materials throughout the lithium-ion battery supply chain, from mineral extraction to electric vehicle application.

This graphic illustrates the flow of cobalt through the Democratic Republic of Congo
(DRC), China, Europe, the rest of Asia (ROAsia), the rest of the world (ROW), and
non-Li-ion EV battery flow. This data comes from NREL Analysis, USGS 2022 Mineral
Commodity Summaries, International Trade Centre, and the Battery Material Manufacturing
database Global Cobalt Outlook 2020–2030.
*Mining, Recycling, and Preprocessing products include ores, naturally occurring
solids containing cobalt, and mattes and intermediates (30%–100% cobalt).
Engage With Us
MMAC relies on industry support to provide rounded insights on the needs and opportunities for energy technologies. Share your feedback, get involved, or ask questions about our work by contacting [email protected].
Share
Last Updated April 3, 2025
