Interconnections Seam Study
Through the Interconnections Seam Study, NREL led national lab, university, and industry partners in quantifying the benefits and costs of options for continental transmission across the U.S. electric grid.
These interconnections would create a more integrated power system that could drive economic growth and increase efficient development and utilization of the nation's abundant energy resources, including solar, wind, and natural gas.

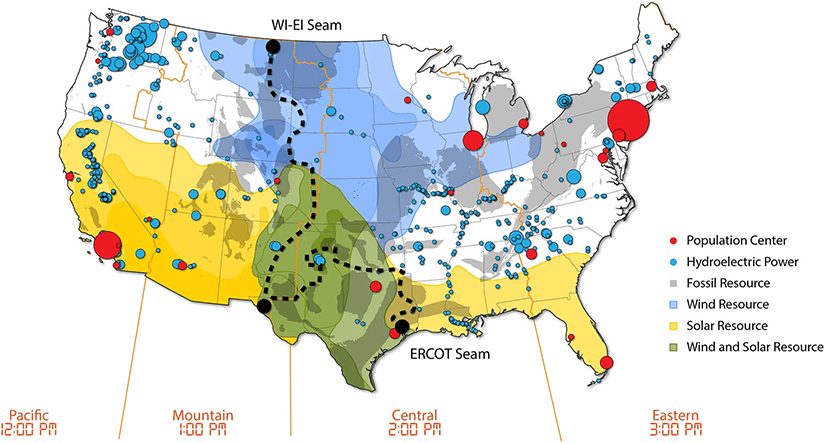
Stitching together the major regions of the U.S. power system, represented here conceptually, could enhance the ability to harness abundant renewable resources and balance loads across the country. WI = Western Interconnection; EI = Eastern Interconnection; ERCOT = Electric Reliability Council of Texas. Per the legend, red dots indicate the top 25 population centers; blue dots indicate hydroelectric facilities; gray shading shows areas with major fossil resource; blue shading shows areas with greatest wind resource; yellow shading shows areas with greatest solar resource; and green shading shows areas with wind and solar resource.
Strengthening the U.S. Power System
The three major components of the U.S. power system—the Western Interconnection, the Eastern Interconnection, and the Electric Reliability Council of Texas—operate almost independently of each other. Very little electricity is transferred between the interconnections due to limited transfer capacity.
This study quantifies the costs and benefits of strengthening the connection (or seam) between the Eastern and Western Interconnections to encourage efficient development and utilization of U.S. energy resources.
Modeling Approach and Results
To evaluate the costs and benefits of potential enhancements of the U.S. interconnection seams, the study team analyzed a suite of power system futures using three classes of power system models: long-term capacity expansion, year-long production cost, and power flow. The end result: in-depth insight on the economic and reliability benefits of the study scenarios.
The study conducted a multi-model analysis that used co-optimized generation and transmission expansion planning and production cost modeling. Four transmission designs under eight scenarios were developed and studied to estimate costs and potential benefits. The results show benefit-to-cost ratios that reach as high as 2.5, indicating significant value to increasing the transmission capacity between the interconnections under the cases considered, realized through sharing generation resources and flexibility across regions.
The study results have been published by the journal IEEE Transactions in Power Systems. A slide deck is also available for download.
The video below and related videos on the NREL Learning YouTube Channel show system-wide generation and transmission flows at hourly time resolution for multiple scenarios and system conditions.
To watch this video in high definition, click play, then click the gear icon, click quality, and select the highest option. You can also expand the video for full-screen viewing.
Methods
Two key models were updated and applied for this study: the Iowa State University CGT-Plan capacity expansion model and Energy Exemplar's PLEXOS production cost model. CGT-Plan was used to design scenarios for a variety of grid conditions through the year 2038. PLEXOS was used to perform unit commitment and economic dispatch on the systems created by CGT-Plan.
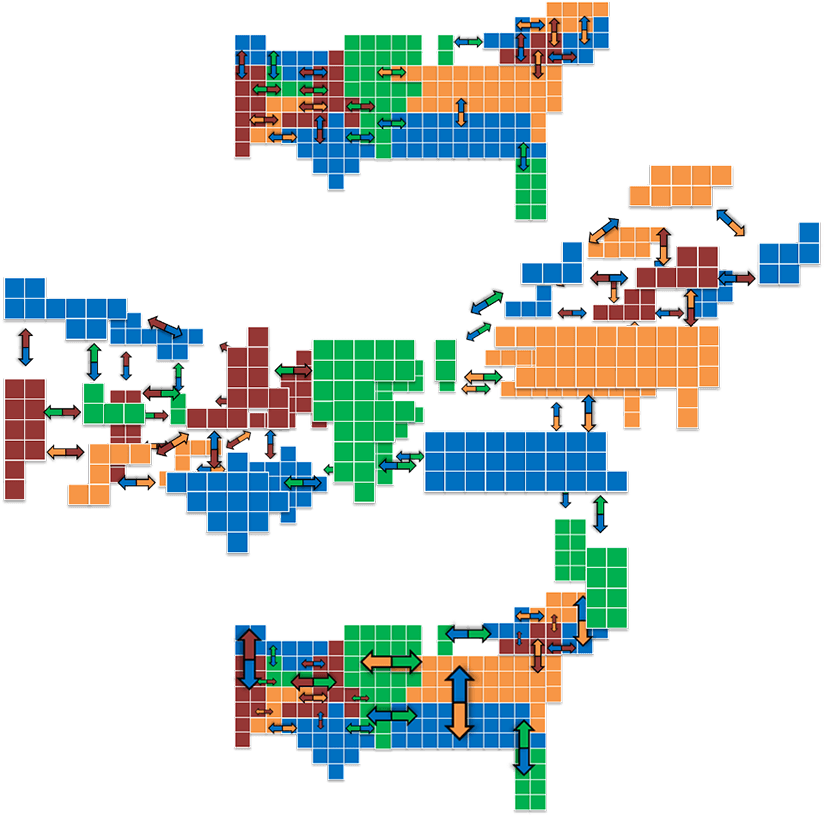
CGT-Plan was used for a variety of different power system scenarios (including technology cost, gas price, transmission costs, and generation retirements) to model transmission and generation co-optimized for four different transmission designs. These designs are shown in the figure below and include:
- Design 1 (top left): No increase in transmission capacity between the interconnections
- Design 2a (top right): Increasing capacity at existing back-to-back ties
- Design 2b (bottom left): Increasing capacity at existing back-to-back ties plus three long-distance HVDC ties between the interconnections
- Design 3 (bottom right): Nationwide HVDC
Read more details about the model in an IEEE Transactions on Power Systems article.


Transmission designs in the capacity expansion work. Top left: Design 1. Top right: Design 2a. Bottom left: Design 2b. Bottom right: Design 3.
The study team used PLEXOS to simulate the operation of the systems produced by CGT-Plan using a geographic decomposition method to estimate powerflows between regions (including both Eastern and Western Interconnections). See another example implementation of PLEXOS using offshore wind energy in the Northeast United States in an NREL technical report.
After modeling powerflows between regions, PLEXOS then modeled a region-specific day-ahead unit commitment for each region and hourly economic dispatch for the entire grid. The method is described in an IEEE Transactions on Power Systems article.


Unit commitment decomposition regions (left) and methods (right).
Pacific Northwest National Laboratory imported several selected NREL production cost model generation dispatch time periods into power flow models to perform initial contingency analysis for evaluating the reliability of each scenario.
Data Sources
The data and assumptions were kept as consistent as possible between the modeling domains and the interconnections. Some of the key data sources are listed below.
Wind
Solar
NREL 2012 National Solar Radiation Database
Transmission and Generation
Western Electricity Coordinating Council (WECC) Transmission Expansion Planning Policy Committee 2024 base – Western Interconnection
Multiregional Modeling Working Group 2026 – Eastern Interconnection
Generator parameters updated with refined assumptions (read an example with thermal plants in an Environmental Science & Technology article)
Load
2012 Federal Energy Regulatory Commission Form 714 and Regional Transmission Operator websites
Cost Assumptions
NREL Annual Technology Baseline for generating technologies
WECC/Black and Veatch for HVDC and alternating-current (AC) infrastructure
Fuel prices from the Energy Information Administration's Annual Energy Outlook

Map of United States Wind Power Resource

Map of Global Horizontal Solar Irradiance

Map of U.S. Transmission System and B2B HVDC Ties
Research Team
National Renewable Energy Laboratory
Pacific Northwest National Laboratory
Midcontinent Independent System Operator
Western Area Power Administration
Technical Review Committee
Representatives from the following utilities, power system operators, and industry organizations helped guide this study by reviewing its assumptions, scenarios, and findings. Although these representatives offered input throughout the study, the results and findings do not necessarily reflect their opinions or the opinions of their institutions.
- Basin Electric Power Company
- Black Hills Energy
- Energy Exemplar
- El Paso Electric
- Electric Power Research Institute
- Electric Reliability Council of Texas
- Energy Systems Integration Group
- Great River Energy
- LS Power
- Midcontinent ISO
- Minnesota Power
- National Grid
- National Rural Electric Cooperative Association
- NextEra
- Public Service Company of New Mexico
- SDG&E
- Solar Energy Industry Association
- Southwest Power Pool
- Transcanyon
- Tri-State Generation and Transmission
- Western Area Power Administration
- Western Electricity Coordinating Council
- Xcel Energy
Future Work
Future work may include:
- Potential reliability and resilience assessment via AC power flow studies with steady-state and stability modeling (expanding on PNNL’s initial work on the topic)
- Consideration of system resilience and security requirements related to weather and extreme conditions
- Evaluation of natural gas delivery infrastructure and gas-electric operational coordination.
Share

